Sound
Introduction Sound is a traveling wave of compressions and rarefactions of molecules. That is, sound is a longitudinal wave. Sound can't travel through a vacuum, so all those science-fiction movies and shows with spaceships loudly blowing up are unrealistic. The speed of sound in air is about 343 m/sec (or about 750 miles/hour). Sound travels faster through liquids and solids, because they are denser.
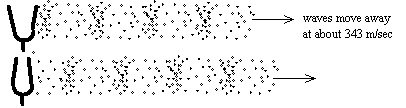
What creates sound? Anything that vibrates. The object bumps into the molecules next to it. Those bump into the next molecules outward, those hit the next ones, and so on. Below is a diagram showing a tuning fork, which vibrates back and forth, whacking air molecules. When the tines of the fork move outwards (top diagram) they push air molecules together, creating a compression. Compressions are areas of higher pressure; rarefactions have lower-than-average pressure. The air molecules themselves don't move far at all, but the compressions move away very quickly.

The above animation is nice, but can we actually see sound? Yes, with a special technique called Schlieren imaging. Watch this...

What's vibrating in various sound-makers?
- In stringed instruments (such as the violin, guitar and cello) it's the strings primarily, but the strings also cause the wood body of the instrument to vibrate.
- Speakers use a paper cone that is vibrated by a changing magnetic force between a wire coil on the cone and a permanent magnet.
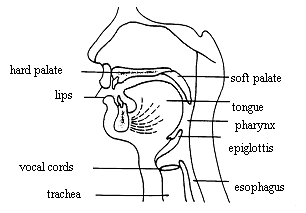
- The human voice is created by vibrating flaps of tissue (called the vocal cords) located in the throat. You can feel your vocal cords vibrating by putting your fingers on your windpipe (the trachea) and humming. Men's voices are deeper (lower pitch) than women's because their vocal cords tend to be thicker. Muscles raise the voice's pitch by stretching the vocal cords, putting more tension on them. When those muscles get tired from too much talking, your voice gets hoarse. If the vocal cords get infected or really irritated, you have laryngitis.
Another name for the frequency of a sound is its pitch. When young, humans can hear frequencies ranging from 20 Hz to about 20 kHz, although our ears are most sensitive in the 1 to 5 kHz range. Frequencies lower than 20 Hz are called infrasonic; frequencies above 20 kHz are ultrasonic. Dogs can hear 15 Hz to 50 kHz; bats can hear 1 kHz to 120 kHz. Because of cumulative damage, our ears get less sensitive as we age, especially at the high-frequency end of the range.
Different musical notes are simply different frequencies. The middle C, for instance, is 261.63 Hz. The C one octave higher, is 523.25 Hz. (An octave is a factor of two increase in frequency.) The F between these two C's has a frequency of 349.23 Hz.
Play with this Windows/PC program (tonegenerator.exe) and listen to different sound frequencies. NOTE: the program does not produce accurate frequencies at the extreme high end. If you move the frequency selector of the program above 20 kHz, you may still hear sound. If so, that's because your computer is actually putting out much lower frequencies, not because you have super-human hearing ability.
Activities & Practice
to do as you read
1. What is vibrating in these sound-makers?
(a) brass instruments (such as the tuba, trumpet and trombone)
(b) clarinet and saxophone
(c) drum
2. Measure the wavelength of the sound wave drawn with the tuning forks to the left. What is the frequency of this sound wave? Can humans hear it?
3. What is the range of sound wavelengths detectable by the ears of
(a) a dog
(b) a bat
(c) a human
4. Sound travels at about 1470 m/sec in seawater. A note of 512 Hz has what wavelength in (a) air, and (b) seawater?
5. In steel, sound travels at about 5050 m/sec. Will a sound in steel will have a shorter, longer, or the same wavelength as the same-frequency sound in air?
6. The speed of sound in air varies a little, depending on the temperature of the air. Thinking about what sound is, do you think the speed of sound increases or decreases with rising air temperature?
7. Why do you think sound travels faster in solids than in air?
8. Submarines use sonar to detect surface ships and other submarines.
A sound wave (a 'ping') is sent out in all directions, which hits the
other ship and reflects (echos) back. The direction of the echo and the
time delay give the location of the target. If the time delay between
emitting the sound and hearing the echo is 1.7 seconds, how far away
is the target?
9. If a tree falls in the forest, and no one is there to hear it, does it make a sound?
Sound Level The loudness or sound level (just two names for the amplitude) of a sound wave is usually measured in units of decibels, dB. The decibel scale is logarithmic: an increase (addition) of 10 decibels means a factor (multiplication) of 10 in sound intensity. For example, a 50 dB sound is ten times louder than a 40 dB sound, which is 10 times louder than a 30 dB sound. (So the 50 dB sound is 100 times louder than the 30 dB sound.)
| Source or description of noise | Sound level, dB |
| Military jet taking off | 140 |
| Threshold of pain | 120 |
| Train | 90 |
| Busy street traffic | 70 |
| Ordinary conversation | 65 |
| Quiet automobile | 50 |
| Library | 40 |
| Average whisper | 20 |
| Rustle of leaves, breathing | 10 |
| Threshold of hearing | 0 |
10. How many times louder is: (a) the rustle of leaves than the threshold of hearing? (b) busy traffic than a whisper?
Sound Spectrum
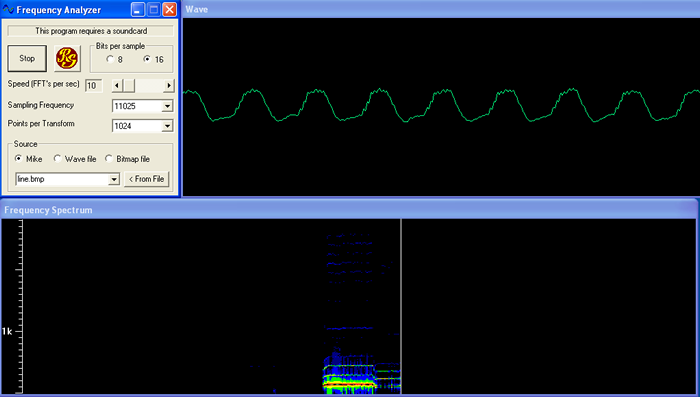
The following link is a PC/Windows program (freeware from the fine folks at Reliable Software, Inc.) that analyzes sound coming into your computer via the microphone, or sounds from a file. (Program: FreqAnalyzer.exe.) Assuming your computer has a microphone (most laptops have them built in), play with making sounds and viewing the spectrogram. Below is a screenshot of the program, as I hum into the microphone. The top-right window ("Wave") shows a live graph of pressure (at the microphone) as a function of time. This graph flickers rapidly in real time. The "crests" of the graph represent compressions reaching the microphone. The bottom window ("Frequency Spectrum") has frequency on the vertical axis, from 0 Hz to 3 kHz. Time is on the horizontal axis, and sound intensity is indicated with a color-code. The vertical white line indicates the current time and data being plotted. In the spectrogram of me humming, you can see that the strongest tone is a bit less than 200 Hz in frequency, but that there are also a series of harmonics (multiples of a lower, fundamental frequency.)
NOTE: on my system, there is "audio enhancement" software within Windows 7 that are designed to make better-sounding recordings by removing noise, and adjusting the sound level to respond to a wide variety of loudness. Unfortunately, these automatic adjustments complicate our analysis, so we need to turn them off. In 32-bit Windows 7, and in Windows 8, go to the Control Panel > Sound > Recording > Properties > Advanced and turn OFF the "enable audio enhancements" feature. In 64-bit Windows 7, apparently the sequence is different: Control Panel > Sound > Recording > Properties > Enhancements > Disable all sound effects.
Here are some sound files to experiment with too. You can use these even if your computer doesn't have a microphone. Right-click and save them on your computer. In the Frequency Analyzer, select "Wave file" as the data source, open one of the files and observe its spectrum.
- pure sine wave, 500 Hz
- pure sine wave, 2000 Hz
- flute
- human voice
- white noise
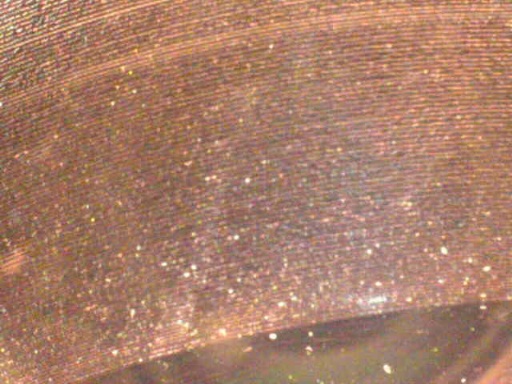
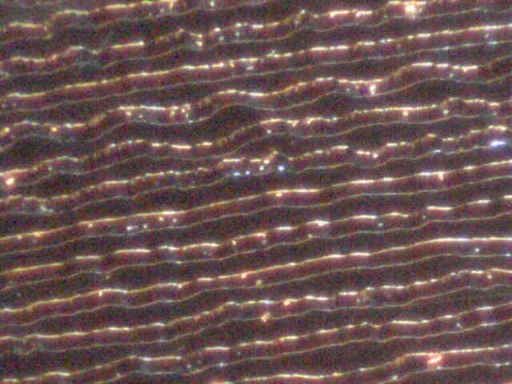
Old-fashioned records record sound in grooves molded into vinyl plastic. A thin needle rides in the groove, but the sides of the groove are not smooth. Instead, the sides wiggle, in the same pattern as the P(t) graph (pressure as a function of time) of the original sound wave. Here (below left) is a picture of one side of a record. It's a sond, "Boogey Down in Mobile, Alabama" by Rocky Burnette. The other photo (below right) is through a microscope, revealing the wiggles in the groove the needle rides in. The motion of the needle gets turned into an electrical signal that is then sent to an amplifier and speaker. However, even with no amplifier or speaker, if you put your ear right next to the needle as the record spins, you can faintly here the song.
Singing Roads (a.k.a. Asphaltophone)..here's a YouTube video
https://www.youtube.com/watch?v=lN8eEOz7PeY
ADDITIONAL PRACTICE
11. An average whisper is about 20 dB. What is the decibel level of a sound that is a thousand times louder?
12. A more advanced sound analysis software package is Soundcard Scope, written by Christian Zeitnitz. It is available at http://www.zeitnitz.de/Christian/scope_en. This is for Windows computers only. Download the installer package to your desktop and then install. Go ahead and run the program and play with it. We'll be using this for a lab.
13. This is the classic movie poster for the 1979 movie Alien. The tagline is "In space, no one can hear you scream." What are they alluding to with that statement? Explain.
